2025 Fall - Fluids and Heat Transfer Laboratory Project
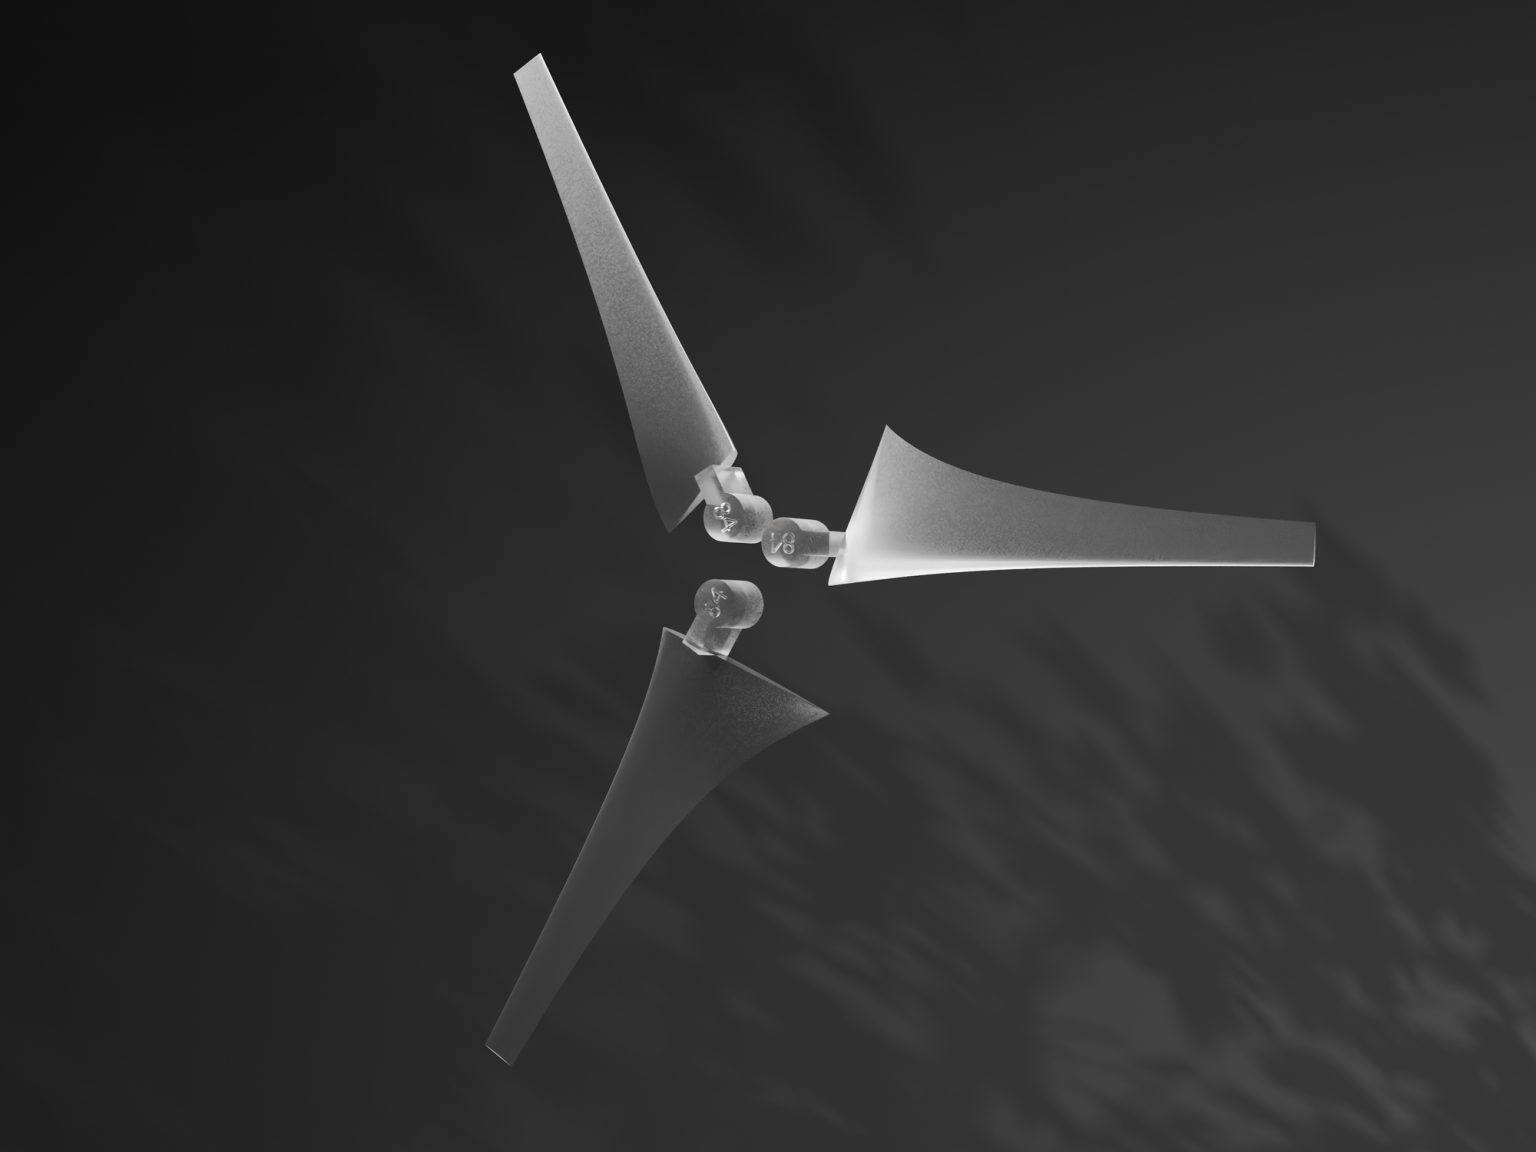
We were tasked with designing a 3D-printed static wind-turbine blade to maximize power extraction at a known wind velocity distribution. The goal was to create a blade whose geometry—airfoil selection, chord distribution, twist—follows fluid-mechanics principles rather than arbitrary shapes. Our design needed to perform well in the lab wind tunnel while remaining structurally reasonable and manufacturable.
Design Process
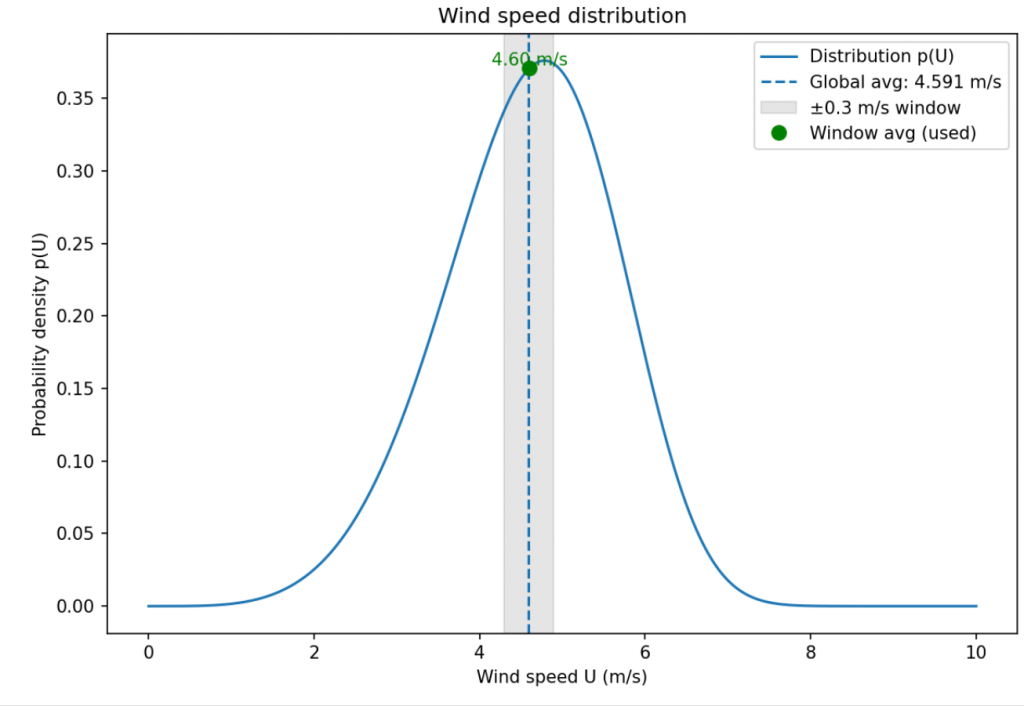
We decided we needed a global effective wind speed, rotation rate design point, and Reynolds number.
We worked out an effective global velocity through several steps of integration over the velocity probability distribution.
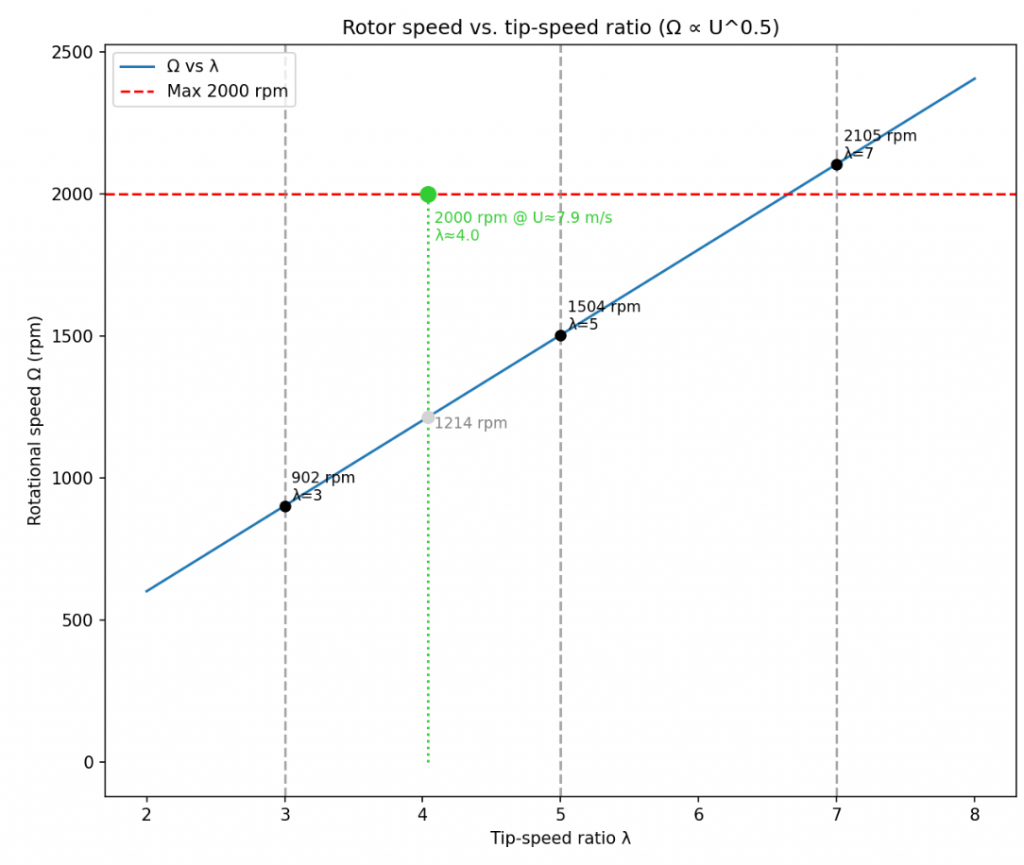
Tip Speed Ratio Selection
Then, we used a tip speed ratio of 4.5 to set a target angular rotation rate. This helped ensure that our base geometry relationships of the blade were in the efficient zone given the operating conditions from the start. We continued by using the set rotation rate and globally approximated wind velocity to calculate a weighted Reynolds number, as we needed it to evaluate airfoil performance.
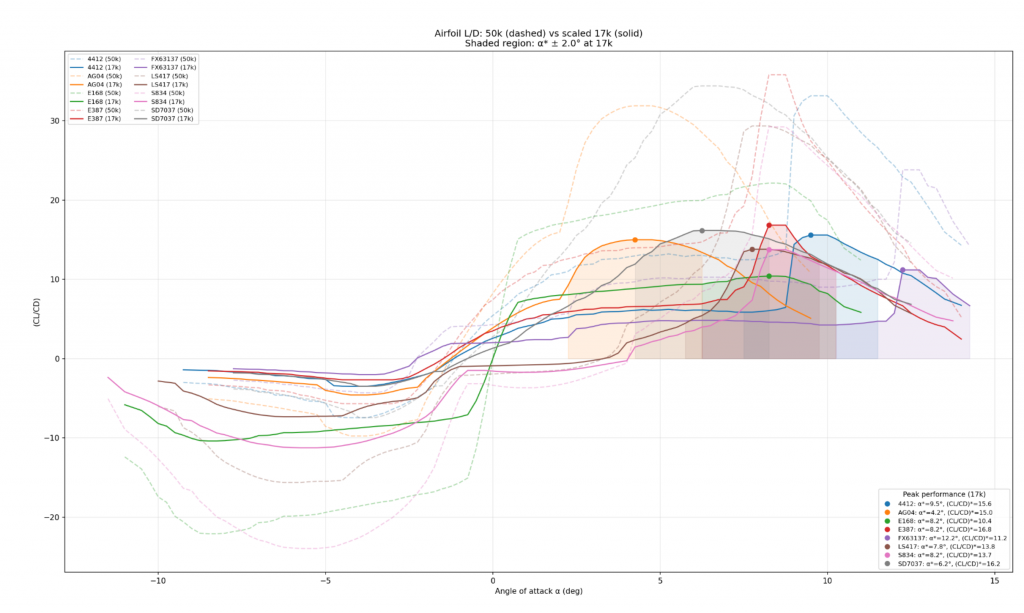
Several low-speed airfoils were selected for comparison. Since the reference data for these airfoils were collected at 50K, and we operate at a much lower Reynolds number, we scaled it down using a power relation to approximate their performance under our conditions.
Airfoil Profile Comparisson
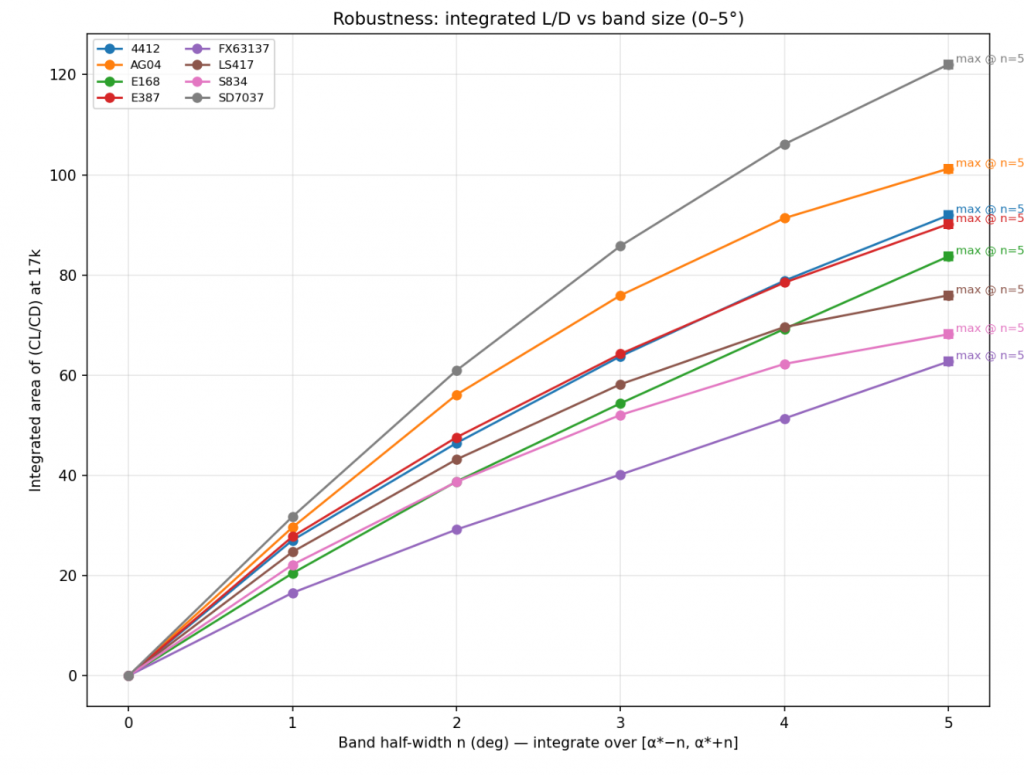
For each airfoil, we generated a scaled performance line as a function of angle of attack. We then found the peak of the performance curve and integrated it over a window that accounts for deviations from optimal performance in real-life conditions.
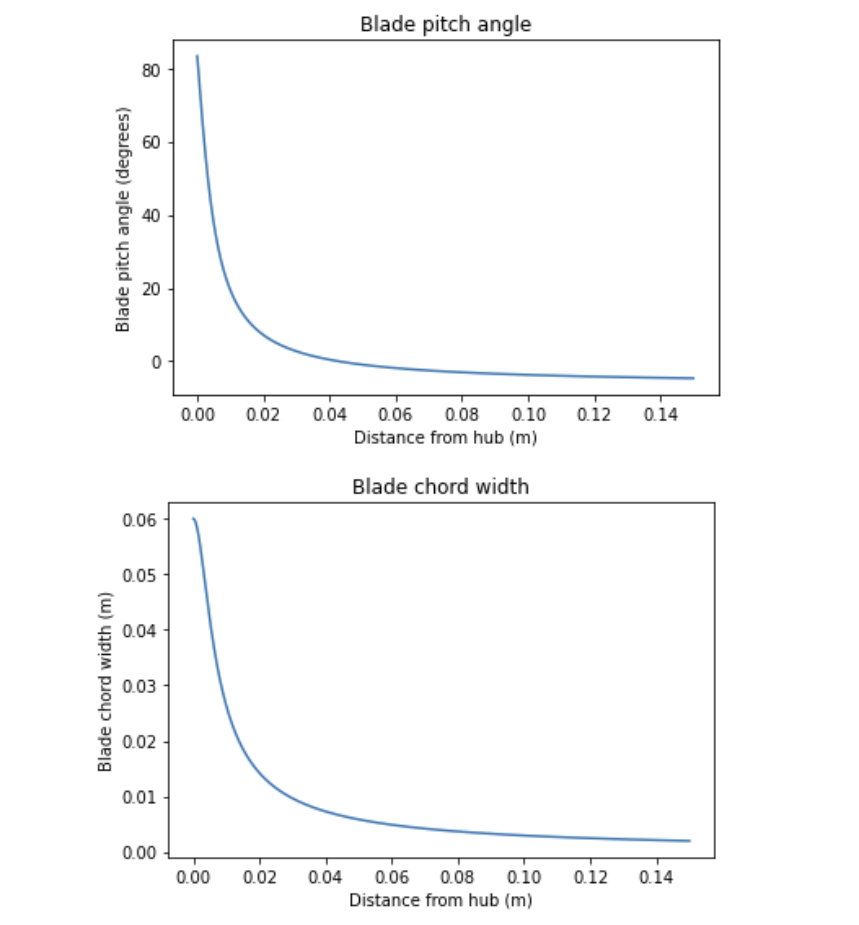
Finally, we calculated the integral over the specified window from 1 to 5 degrees. We clearly see SD7037 performs the best. This is our airfoil of choice. Using its performance data, we calculated the chord length and pitch as a function of airfoil radius using two equations from Mathematical methods from Wind Energy Explained (Manwell, McGowan, & Rogers, 2009)
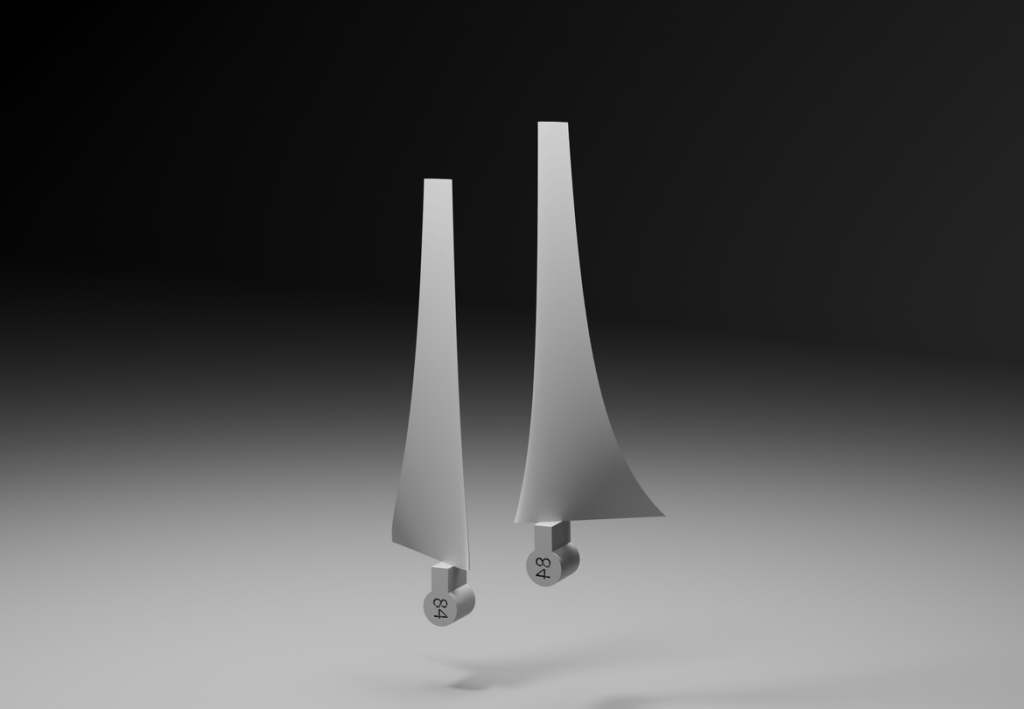
These were then used to create 10 profiles in Fusion360, and the final geometry was modeled with a loft command.
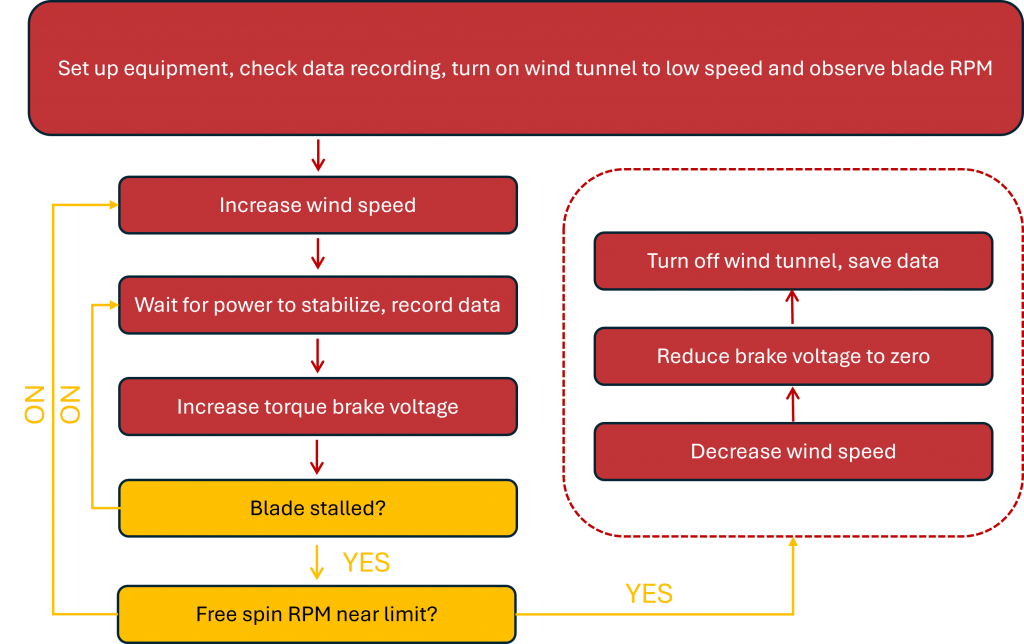
Testing Summary
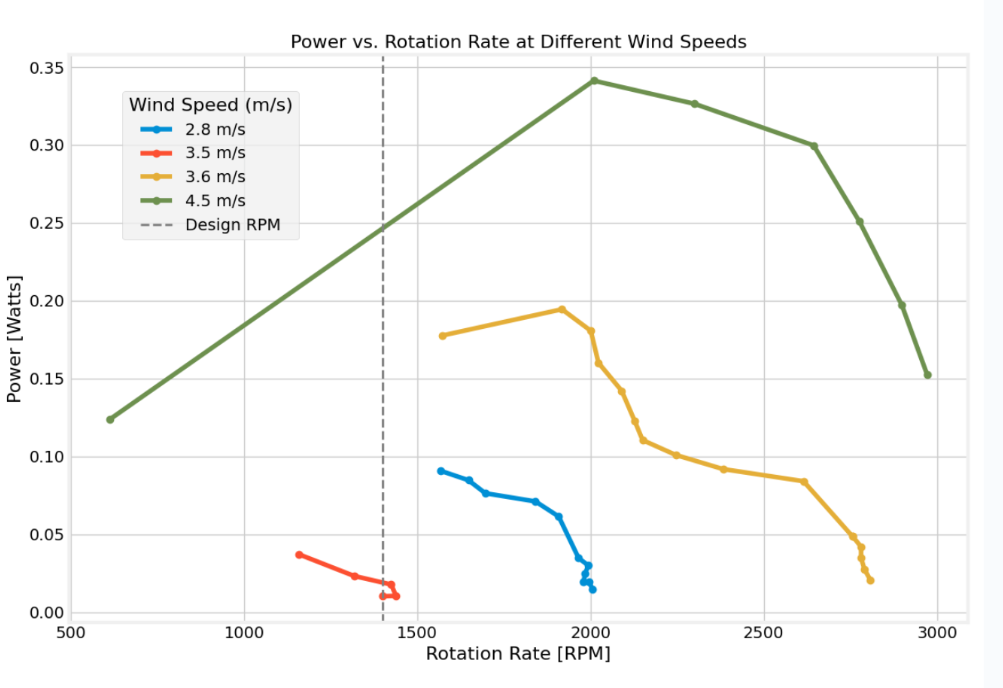
To test the blade, we operate it in a wind tunnel and collect data at various speeds across the design envelope. Then we compare the results to our model’s prediction.
During the experiment, we experienced large static friction, such that the rotor does not rotate until the wind speed exceeded the design point. When the rotation rate jumped as the static friction was overcame, the turbine operated at much higher speed than we anticipated. Near the design point of
, we noticed increasing vibrations and concluded that it was near the resonance, and thus stopping the test.
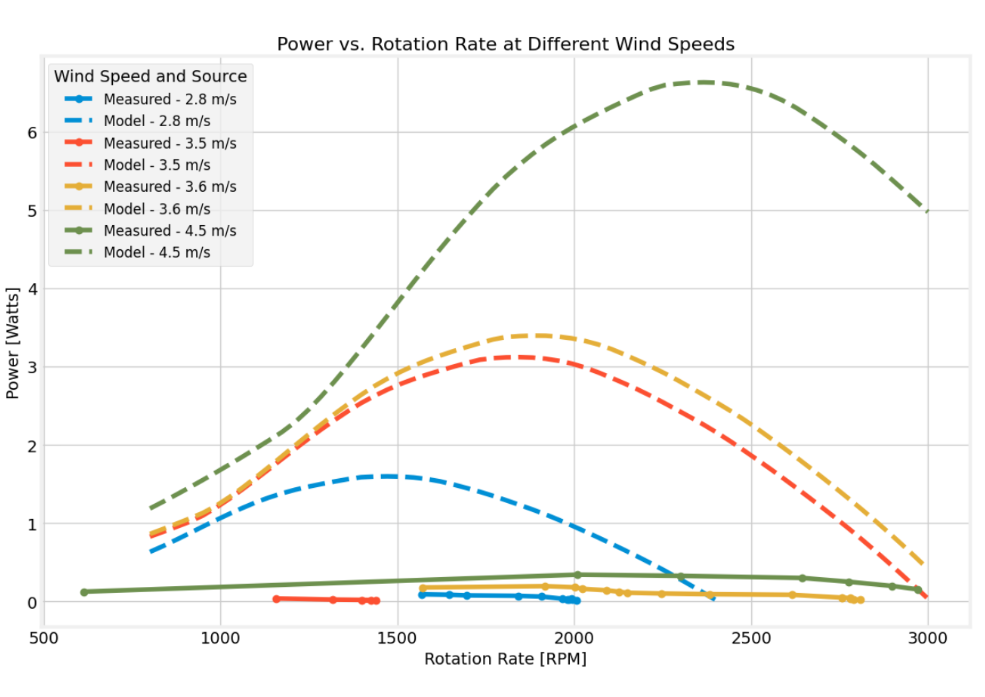
There’s an order of magnitude difference between the prediction from our model and our data. We later found out that this was an issue during CAD, that we mirrored the blade profile about the axis of rotation. This turned the design from a lift-machine into an impulse machine, which would explain the very different result from our experimental values.
Contributions
I was responsible for the complete airfoil-selection workflow. This includes:
finding the global reference velocity
finding the design-point rotation rate and effective Reynolds number
finding and processing reference airfoil data and scaling them to our operating Reynolds number, modeling, and analysis
identifying SD7037 as the optimal choice and validating the selection against our design targets